
Overview
When I released my poker app “Exotic Poker,” I wrote that I decided against implementing a HUD (Head-Up Display) because it was too difficult. Now, as I plan to implement it, I want to outline the considerations involved. You might think, “It’s just calculating and aggregating data, right?” But there are more complexities than you might expect. I hope this explanation clarifies where the difficulty lies. Furthermore, once these data designs are decided, it can be difficult (though not impossible) to change them later. Therefore, it’s necessary to decide based on considerations like how much information you want to display in the future, or how you intend to use it.
Aggregation Units for Stats (Statistical Information)
Player statistics should ideally be aggregated separately for each type of game playable within the poker app and for each economic condition. For example, if a game only allows playing 6-max Texas Hold’em Ring Games, a single aggregation unit might suffice. However, if game types include both Texas Hold’em and Omaha, mixing them would likely yield meaningless statistics. Similarly, since strategy and statistics change with table size and position, managing them separately is preferable. Strategy also varies between Ring Games, S&G (Sit & Go), and MTT (Multi-Table Tournaments).
It’s necessary to define these key pieces of information that serve as aggregation units beforehand. Storing each individual game data point and aggregating the required data each time is inefficient. Performance can be improved by creating and managing intermediate tables (tables that calculate aggregated values per key) for computing statistics. Defining the key information that serves as the aggregation unit for these intermediate tables is advisable. In the author’s games, all these game conditions can be arbitrarily changed, so classifying by the following key information is preferable:
- Game Type: Texas Hold’em, Omaha, etc.
- Economic Condition Type: Ring, S&G, MTT, etc.
- Number of Players: 2 to 12
- Position: BN, SB, BB, etc.
- Stack: -10bb, 10-20, 20-30, 30-50, 50-100, 100- etc.
Of course, the values you want to display on screen might sometimes be averages ignoring player count, stack, or position. In such cases, you can simply aggregate and calculate the relevant data from intermediate tables.
Types of Stats
In general poker apps, tapping an opponent displays data like their VPIP or win rate. You also need to decide beforehand what statistical information you want to display in your own game app. Additionally, be aware that finer-grained statistics will be needed if you plan to build models where AI actions are determined by considering opponent statistics, or if you intend to define the AI’s own action patterns based on statistical data.
For now, the items I want to display on the screen (though I expect I’ll have to narrow it down due to the limited space on a smartphone screen) and the statistics I want the AI to utilize are envisioned as follows.
- Pre-flop
- Number of hands: An indicator representing the reliability of the statistics
- VPIP (Voluntary Put in Pot): The percentage of times the player voluntarily put chips into the pot pre-flop
- PFR (Pre-Flop Raise): The percentage of times the player raised pre-flop
- 3Bet: The percentage of times the player actually 3-bet in situations where 3-betting was possible
- F23B: The percentage of times the player folded to a 3-bet
- (Other data, such as 4-bets and beyond)
- Post-Flop
- Aggression Factor: Number of times you chose to bet or raise / Number of times you called
- Aggression Frequency: Number of times you chose to bet or raise / Number of times you took an action other than checking
- Continuation Bet: Percentage of times you actually made a CB in situations where a CB was possible
- Action to Continuation Bet (Fold to CB, Call to CB, Raise to CB)
- Donk Bet: Percentage of times a DB was actually made in situations where a DB was possible
- Action to Donk Bet (Fold to DB, Call to DB, Raise to DB)
- Check Raise: Percentage of times a CR was actually made in situations where a CR was possible
- Action to Check Raise (Fold to CR, Call to CR, Raise to CR)
- Stage Seen (Flop Seen, Turn Seen, River Seen)
- Showdown
- Win%: Number of hands won chips / Total hands played
- Win Rate: Average chips won per 100 games (bb equivalent)
- WTSD (Went to Showdown): Number of hands that went to showdown / Number of hands that saw the flop
- W$SD (Won Money at Showdown): Number of hands won chips at showdown / Number of hands that went to showdown
It might seem a bit greedy, but implementing a model that determines AI actions based on statistics likely requires this level of data.
Foundational Information for Calculating Stats
To calculate the stats shown in the previous section, foundational information must be logged and stored for each game to compute these metrics. VPIP, RFP, 3Bet, CB, and DB are generally calculated as ratios of the number of times the action was actually chosen out of the total number of opportunities to perform that action, rather than the total number of hands. For example, CB is calculated as the ratio of how often you bet the continuation bet when you were the aggressor and were not donk bet. To calculate this, it is necessary to record as a flag the number of times you were the aggressor and were not donk bet, and whether you bet in that situation.
VPIP is difficult to understand. You might think that the denominator could be the number of hands, but if you are in the BB position and all the players before you fold, the number of hands is +1, but the denominator of VPIP must be counted as +0 because you did not have the opportunity to voluntarily put chips in. VPIP must be calculated by dividing the number of times you called or raised preflop (VPIP_count) by the number of opportunities to voluntarily put chips in (VPIP_opportunity).
In the case of Fast Fold
In the case of Fast Fold, you can fold even though it is not your turn, but how should the stats be calculated in this case? Generally, it seems that the aggregate value is calculated based on the situation at the time of the fold. In other words, the aggregate value is calculated assuming that it was your turn next at the time of the fold. This seems to cause a certain bias in the stats compared to when you wait until your normal turn to act.
In Fast Fold games, the 3bet% rate tends to be observed around 3% higher (9–11%) compared to standard games (6–8%), and F23B (Fold to 3Bet) also appears higher. Due to strategic differences stemming from rule variations and measurement biases in aggregate values, Fast Fold games and non-Fast Fold games cannot be compared as identical entities, so caution is warranted. While such distinctions may not be strictly necessary, it might be prudent to include whether Fast Fold is enabled in the key for statistical aggregation.
Utilization in AI (NPC)
While humans use stats to infer opponents’ tendencies, apps utilizing AI (NPC) can also employ them in several ways. For example:
- Using stats to verify if the developed algorithm is executing the intended strategy.
- Adopting an AI algorithm that references opponent stats to adjust its strategy based on the opponent’s characteristics (using them as parameters for the AI’s decision function).
- Providing AI algorithms that replicate specific stat profiles (e.g., VPIP, CB) by specifying those stat values.
In the author’s app, the third use case might be particularly important. Current NPCs use an algorithm that selects actions to maximize expected utility. However, this results in them mindlessly making CBs and Donk Bets, making them appear less like human players. Specifying stats and adjusting actions to match those values might lead to more human-like behavior. It would be interesting to have features like setting these data points as parameters for the AI model and actually playing against it. For now, I’m considering developing a feature to aggregate and display stats, then adding an AI algorithm to “Exotic Poker” that determines strategy based on specified statistical targets.
Appendix: Implemented Screen
I intended to implement this after finishing writing the article, but it ended up being completed almost simultaneously. The latest version of the poker app “Exotic Poker,” developed by the author, now features a HUD. To promote the app, here’s a screenshot (numbers are test data, so arbitrary).
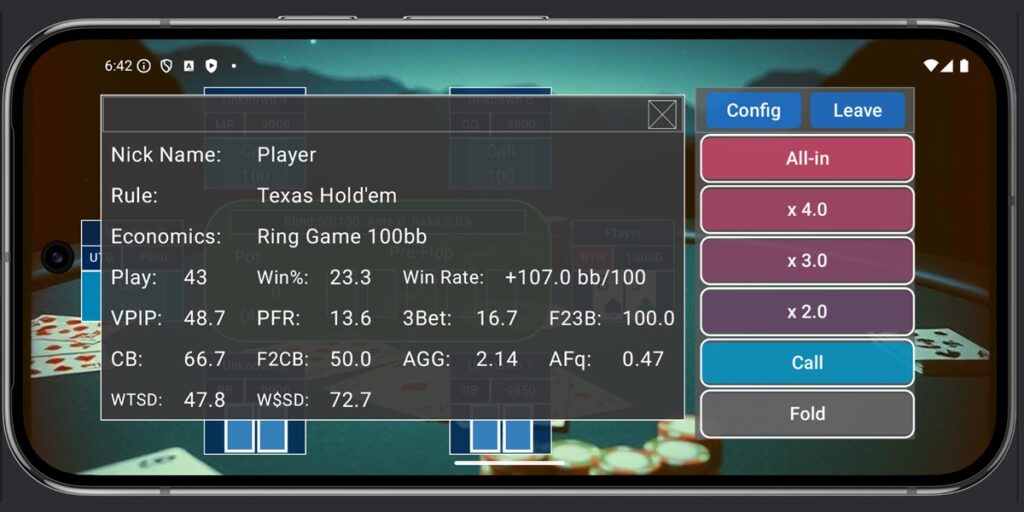
I calculated whatever I could without overthinking it, so more metrics are displayed than usual. CB (Continuation Bet) and F2CB (Fold to CB) internally hold data per stage, but the screen shows Flop data. AGG and AFq are calculated using post-flop aggregate values. This should be sufficient for gauging player tendencies.
For single-player mode (games against NPC opponents), I plan to implement Fast Fold as soon as possible. This will allow players to check their own play statistics and enable rapid data input for AI training.

Comments