There are many empirical rules in the world that somehow seem to hold true. One well-known rule of thumb is that the top 20% of the members (or components) of an organization or any collection of entities will occupy 80% of the resources in that organization. Typically, the top 20% of people in a nation or company account for 80% of the income distribution. The person who proposed this was the economist Vilfredo Pareto, and this rule of thumb is known as the Pareto Principle. In business, this is sometimes referred to as the 80:20 Principle. The income distribution observed in developed countries today does not appear to be as disparate as the Pareto Principle, but it is unclear what the actual situation is. Since this is a mathematics blog, I will only briefly touch on the economic or sociological considerations at the end, and let’s take a quick look at the mathematics behind this law.
The Pareto principle states that the income distribution function such that citizens with an income of \(\small x\) are in the top \(\small \xi \) percent follows
\[ \xi=P(x) = cx^{-a}. \]
The smaller \(\small a \), the greater the inequality in the income distribution. Since \( \small P(x)\leq 1 \), we can set a lower limit on income and obtain
\[ \underline{x}=\sqrt[a]{c}. \]
Therefore,
\[ P(\underline{x}) = 1 \]
holds. Similarly, the income required to be in the top 20% is given by
\[ \dot{x}=\sqrt[a]{5c}. \]
The total income of the top 20% of the population accounts for 80% of the total income, which can be expressed as:
\[ \frac{\int_{\dot{x}}^\infty x\frac{dP(x)}{dx} dx}{\int_{\underline{x}}^\infty x\frac{dP(x)}{dx} dx} = 0.8. \]
The sign is confusing, but it is represented as:
\[ p(x)=-\frac{dP(x)}{dx} = acx^{-a-1}. \]
When calculating the indefinite integral, we get
\[ \int xp(x) dx = -ac\frac{x^{1-a}}{a-1}+C, \]
so if we assume \(\small a>1\),
\[ \int_{\dot{x}}^\infty x p(x) dx = ac\frac{\dot{x}^{1-a}}{a-1} \\ \int_{\underline{x}}^\infty x p(x) dx = ac\frac{\underline{x}^{1-a}}{a-1} \]
holds true.
Substituting into the original equation, we get
\[ \dot{x}^{1-a} = 0.8\underline{x}^{1-a}. \]
Hence,
\[ 5^{\frac{1-a}{a}}c^{\frac{1-a}{a}} = 0.8c^{\frac{1-a}{a}} \]
can be obtained. Therefore, all we need to do is set the parameter \( \small a \) so that
\[ 5^{\frac{1-a}{a}} = 0.8 \]
is satisfied. When we actually calculate it, we get
\[ a=\frac{1}{1+\log_5 0.8}\approx 1.161. \]
This is the parameter value that makes the Pareto principle valid. It is said that the \(\small a\) observed in reality is around 1.5 to 2.5, so it may be that the inequality assumed by the Pareto principle assumes parameters that are larger than the income distribution actually observed. To standardize total income to 1, since
\[ \int_{\underline{x}}^\infty x\frac{dP(x)}{dx} dx = ac\frac{\underline{x}^{1-a}}{a-1} = 1, \]
we can simply define \(\small c \) as:
\[ c=\left(\frac{a-1}{a}\right)^a. \]
In the calculations so far, we have considered the income distribution in terms of income amount \(\small x\), but let’s consider the income distribution along the axis of the top percentage of income earners. (Because we want to sort by lowest income) The income and population density of the top \(\small (1-\delta)\)% can be expressed as:
\[ \begin{array}{l} x_\delta = \sqrt[a]{\frac{c}{1-\delta}} \\ P(\delta) = cx_\delta^{-a} = 1-\delta \\ p_\delta = \frac{dP(\delta)}{d\delta} =-1 \end{array} \]
from the Pareto income distribution. The function:
\[ L(z) = \int_0^z x_\delta p_\delta \;d\delta, \quad z \in[0,1] \]
that calculates the income distribution for this \(\small \delta\) is called the Lorenz curve. By simple calculation,
\[ \begin{align} L(z) &=-c^{1/a}\int_0^z (1-\delta)^{-1/a} \; d\delta = c^{1/a} \left[- \frac{a}{a-1} (1-\delta)^{\frac{a-1}{a}} \right]_0^z \\ &= c^{1/a}\frac{a}{a-1}\left(1-(1-z)^\frac{a-1}{a}\right) \end{align} \]
can be obtained. If total income is normalized to 1, the Lorenz curve is:
\[ L(z) = 1-(1-z)^\frac{a-1}{a}. \]
The Lorenz curve is further integrated with \(\small z\) to obtain
\[ G = 1-2 \int_{0}^1 L(z)dz, \]
which is used as an indicator of the degree of inequality in income distribution, called the Gini coefficient. Do the calculation (it’s complicated so use a mathematical software) and we get
\[ \int_{0}^1 L(z)dz = \frac{a-1}{2a-1}. \]
Hence, the Gini coefficient can be calculated as:
\[ G = \frac{1}{2a-1}. \]
Substituting the Pareto principle \(\small a=1.161\), we get \(\small G=0.756\), which results in a significant disparity in income distribution. With realistic values \( \small a=1.5 \sim 2.5\), the Gini coefficient would be around 0.25 to 0.5. By the way, in \(\small a\leq1\), the income of high-income earners diverges infinitely (the integral cannot be calculated), so the Gini coefficient becomes 1.
Since this is all just mathematical formulas and it’s hard to visualize, let’s compare it with Japan’s income distribution. If we assume that the minimum wage is 1,000 yen per hour and 160 hours per month, we can assume that the minimum income would be 1.92 million yen (although many people may disagree). If \(\small a=1.161 \), then \(\small c=19710009 \). If we calculate the amount of income required to be in the top 20% in this case, it actually comes to exactly four times the minimum income, or 7.68 million yen. Similarly, the top 10% would receive 13.95 million yen, the top 5% would receive 25.34 million yen, and the top 1% would receive 101.39 million yen. These amounts seem far too high for the real world. If we adjust the value of \(\small a \) to match Japan’s Gini coefficient, Japan’s Gini coefficient before income redistribution is apparently 0.57 (0.38 after taking into account taxes etc.), which is equivalent to approximately \(\small a=1.3772 \). If we apply the same calculation, the income required to be in the top 20% would be 6.18 million yen, the top 10% would be 10.22 million yen, the top 5% would be 16.9 million yen, and the top 1% would be 54.39 million yen. Well, it’s not too far off the mark. We can imagine that those with an annual income of 6 million yen or less are the working class, those with an annual income of 6 million to 20 million yen are the middle class, and those with an income above that are the capitalist class.
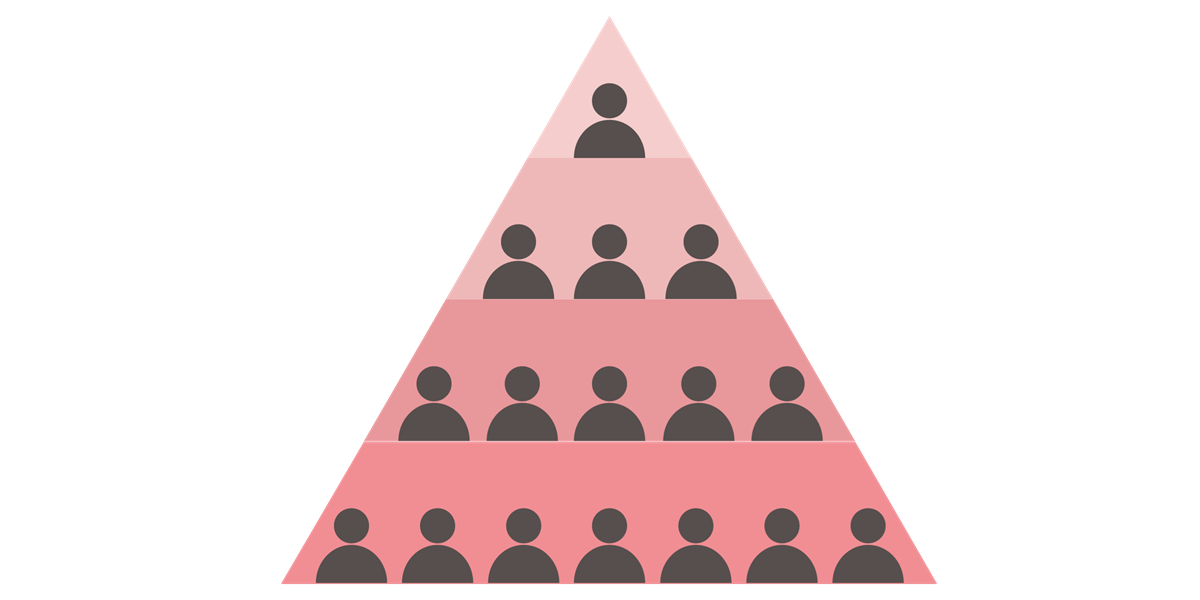
Finally, let me conclude by considering from a sociological perspective why such a structure tends to arise, even if it is only an approximation. Human organizations are basically constructed based on the relationship between those who manage (rule) and those who are managed (ruled), and it is speculated that this is because the number of people managing and being managed follows a power law. For example, when one manager manages two people, this management system often takes the form of a nested structure (pyramid organization). In other words, there is a tendency for the members of an organization to be ranked and managed in a power-law manner, with one president managing two directors, those two directors each managing two department heads, the four department heads each managing two section managers, and so on. This probably means that the same law applies when considering a huge organization such as a nation.
Of course, one manager does not necessarily manage two people, and income distribution at each level depends in part on each organization’s profit distribution policy, so it may not be possible to make generalized statements. However, humans seem to have a tendency to think of social structure in terms of four hierarchical levels, and to believe that resources must be allocated so that higher hierarchies can dominate lower hierarchies. In this case, if the personnel composition of the four hierarchical levels is 1:2:4:8 and the resource allocation is 8:4:2:1, the higher hierarchical levels will have enough resources to suppress a rebellion even if the lower hierarchical levels conspire to rebel. This distribution may lead to the rule of thumb that the top 20% (top two tiers) occupy 80% of resources. Incidentally, in GvG (Guild vs. Guild) social games, it is possible for a group to have 15 members (including one leader and two subleaders), and it seems that the game is designed with this in mind.
Reference
[1] Koch, Richard. 2001. The 80/20 Principle: The Secret of Achieving More with Less. Nicholas Brealey Publishing.
[2] Pareto, Vilfredo. 1896. Cour d’Economie Politique (Course of Political Economy). Laussanne.

Comments