
Overview
Lately, I’ve been constantly checking the Kioxia message board (even though I have no intention of trading the stock), and I’ve started seeing a term—perhaps a buzzword? in Japan —called “Spiritual Momentum Chimpanzee” (SMC). To summarize the meanings of the terms, it appears that the general meanings are:
- Spiritual: Making decisions based on superstitions lacking a theoretical basis. Conducting financial astrology analysis.
- Momentum: A trend-following strategy that involves buying stocks showing strong upward price momentum.
- Chimpanzees: They completely ignore fundamentals (such as PER and PBR). The term is sometimes even used as a synonym for “full-leverage margin trading.”
To tell you the truth, I myself was half-jokingly researching something like a trading model using financial astrological magic numbers for a while, and wrote something like a paper on it. I’ve uploaded it to SSRN, so I’ll post a link.

Since the opportunity has arisen, the purpose of this article is to jump on the bandwagon and briefly introduce a trading model I devised some time ago.
Definitions of Terms
To define the trading model, let us clearly define the terminology. While these definitions may differ from their standard meanings, they are established specifically for the model presented in this article.
In this context, the “spiritual” approach is defined as the practice of assigning “magic numbers” exogenously—based on the belief that stock prices exhibit a certain periodicity, even in the absence of a theoretical basis. Well-known examples include the parameters used in the Ichimoku Kinko Hyo (such as 9, 17, and 26) and Fibonacci numbers (such as 2, 3, 5, 8, 13, and 21). Moving average periods (such as 5, 25, 75, and 200) might also be included in this category. The “spiritual” aspect of this paper lies in incorporating the periodicity associated with this “magic number” into the model. Note that the model does not take into account financial astrological calendars (such as Rokuyo—e.g., Taian or Butsumetsu) or astronomical analyses (such as sunspot cycles or zodiacal cycles).
“Momentum” is originally a term from physics and can be equated with velocity; if the stock price is viewed as a position, the term represents the rate of change of the stock price over time. If continuous stock price fluctuations can be represented as \(\small x(t) \) and are differentiable with respect to time, then
\[ \small p(t) = \frac{dx(t)}{dt} \]
would correspond to momentum. In this context, “momentum” refers to a model that makes trading decisions based on such momentum.
The term “chimpanzee” here implies that the model relies exclusively on stock price time-series data, disregarding all other information. In other words, it is a model that makes trading decisions based solely on technical analysis—specifically, the analysis of stock price charts.
Based on the definitions above, we consider a trading model, starting with the issue of how to estimate momentum. Although stock prices are generally discrete in time—making it impossible to calculate a time derivative—we present a method for estimating momentum that accounts for periodic fluctuations by employing a mathematical model.
Financial Time Series Models
Let the magic numbers of the period parameters be given as \(\small c_1,\cdots,c_m\). For example, in the case of the Ichimoku Kinko Hyo, one would set the values as \(\small c_1=9, c_2=17, c_3=26, \cdots \). In this case, the term representing the periodicity of the stock price is expressed as a linear combination of the trigonometric functions \(\small \sin(t), \cos(t)\). By adding terms representing the average level and trend of the stock price, as well as a noise term \(\small \epsilon_t\), we assume that the stock price time-series data follows
\[ \small x_t = \bar{x} + \beta_0 t + \sum_{i=1}^m \alpha_i \sin\left( \frac{2\pi t}{c_i} \right) + \beta_i \cos\left( \frac{2\pi t}{c_i} \right) + \epsilon_t. \]
The parameter of this model is \(\small \bar{x},\beta_0,\beta_1,\cdots,\beta_m,\alpha_1,\cdots,\alpha_m\). Parameters can be estimated via regression analysis based on time-series stock price data observed over specific intervals (such as six months or one year). By using the estimated parameters and considering a model consisting solely of the noise-free terms, it is possible to estimate
\[ \small \hat{x}(t) = \hat{\bar{x}} + \hat{\beta}_0 t + \sum_{i=1}^m \hat{\alpha}_i \sin\left( \frac{2\pi t}{c_i} \right) + \hat{\beta}_i \cos\left( \frac{2\pi t}{c_i} \right) \]
and the intrinsic stock price. Since this function is continuous with respect to time \(\small t \), it is differentiable. Therefore, the momentum value can be estimated as:
\[ \small \hat{p}(t) = \frac{d\hat{x}(t)}{dt} = \hat{\beta}_0 + \sum_{i=1}^m \hat{\alpha}_i \frac{2\pi}{c_i} \cos\left( \frac{2\pi t}{c_i} \right) – \hat{\beta}_i \frac{2\pi}{c_i} \sin\left( \frac{2\pi t}{c_i} \right). \]
Since the return relative to the stock price is what matters, stocks with a higher ratio of this estimated momentum value to the stock price would likely be recommended for purchase, while those with a lower ratio would be recommended for sale. The task, then, is to calculate this estimate daily for all stocks under surveillance.
Momentum and Oscillators
By using the model from the previous section, one can compare the strength of the trend based on the ratio of the estimated momentum to the stock price. On the other hand, many traders likely wish to avoid buying stocks that exhibit excessively volatile price movements. I also want to incorporate a contrarian strategy into the model—specifically, buying stocks that are in a strong overall trend but have recently declined. Indicators used as criteria for such contrarian trades are known as “oscillators,” and I will explain how to approach them within the context of the model discussed in the previous section.
The difference between the observed stock price \(\small x_t \) and the intrinsic stock price \(\small \hat{x}(t) \) estimated from the model can be viewed as a deviation caused by temporary noise—a discrepancy that resolves over time. Consequently, this deviation could serve as an oscillator indicating overbought or oversold conditions.
By combining momentum and this oscillator at a specific ratio \(\small \omega\) and selecting stocks based on Indicator:
\[ \small s = \omega \frac{\hat{p}(t)}{x_t} + (1-\omega) \frac{\hat{x}(t)-x_t}{x_t}, \]
it may be possible to effectively avoid stocks with strong (or weak) momentum that have experienced excessive upward (or downward) movement over the past one or two days. Of course, by setting \(\small \omega=1\), it is possible to make decisions based purely on momentum. Ranking the stocks according to their scores should make it easy to identify favorable ones.
Trading Model
Based on the discussion so far, it should be possible to identify the specific stocks to trade and the direction of the trades. All that remains is to establish the trading method based on this. There are likely two key components of
- Time Horizon
- Portfolio Diversification.
It is probably best to determine these somewhat mechanically, depending on your preferences. Examples of timeframes include the following.
- Day Trading: A method of taking a position at the market open (or close) and executing an offsetting trade at the market close (or open).
- 1-Day Swing: A strategy of opening a position at the market open (or close) and closing it at the market open (or close) of the following day.
- Swing Trading: A method of mechanically rotating positions based on a set timeframe, such as three days or a week.
- Profit Targeting: A method involving executing an offsetting trade to close out a position once a certain level of profit or loss is reached. It may be effective to also set a time limit—such as a rule not to hold a position for longer than one week—in conjunction with this approach.
Portfolio diversification involves allocating funds across the top few stocks, rather than concentrating them solely on the single highest-scoring stock. By maintaining equal proportions of long and short positions, the portfolio becomes less susceptible to the overall direction of the market (a method known as a market-neutral strategy). A simple example is outlined below.
- A method of specifying the number of assets \(\small N\) and allocating funds in equal portions of \(\small 1/N\).
- A method of specifying the number of securities \(\small N\) and allocating shares proportionally based on scoring.
\[ \small \theta_i = \frac{s_i}{\sum_{k=1}^N s_k } \]
From a financial engineering perspective, one could calculate return variance and perform portfolio optimization, but for an individual, this level of analysis is likely sufficient.
Calculation Example (Kioxia)
As a practical application of the model described in this article, we estimate momentum using Kioxia’s recent stock price data. Given that Kioxia is a stock that has risen with very strong momentum, it aligns well with the model, and one can infer that backtesting would yield significant returns (as of July 2026).
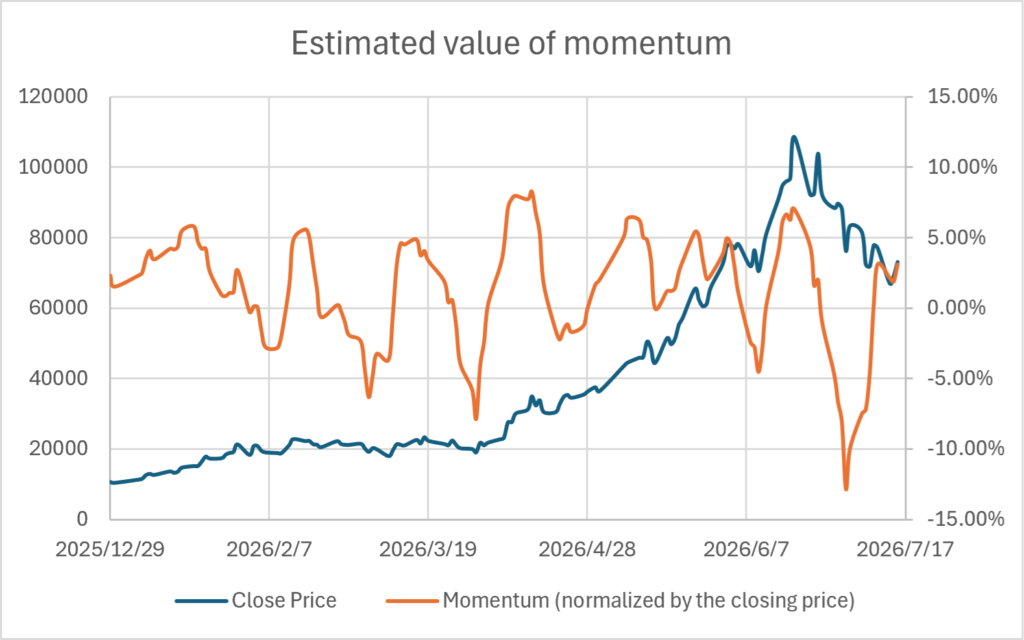
Here, the values 9, 17, 26, 33, 42, 52, 76, and 129—known as the “magic numbers” of the Ichimoku Kinko Hyo—are used as the spiritual parameters. Regression analysis is performed using closing price data from the most recent 130 trading days. The dataset size is fixed at 130 because the maximum value among the cyclical parameters is 129; arbitrarily increasing the amount of data would merely degrade the quality of the fit. Note that the data available for estimation is limited to stock prices known up to that point in time. For instance, when estimating momentum as of June 30, 2026, the model must be estimated using only data from June 29, 2026, or earlier. The trajectory of the estimated momentum, derived by applying regression analysis to actual closing price data, is shown below.
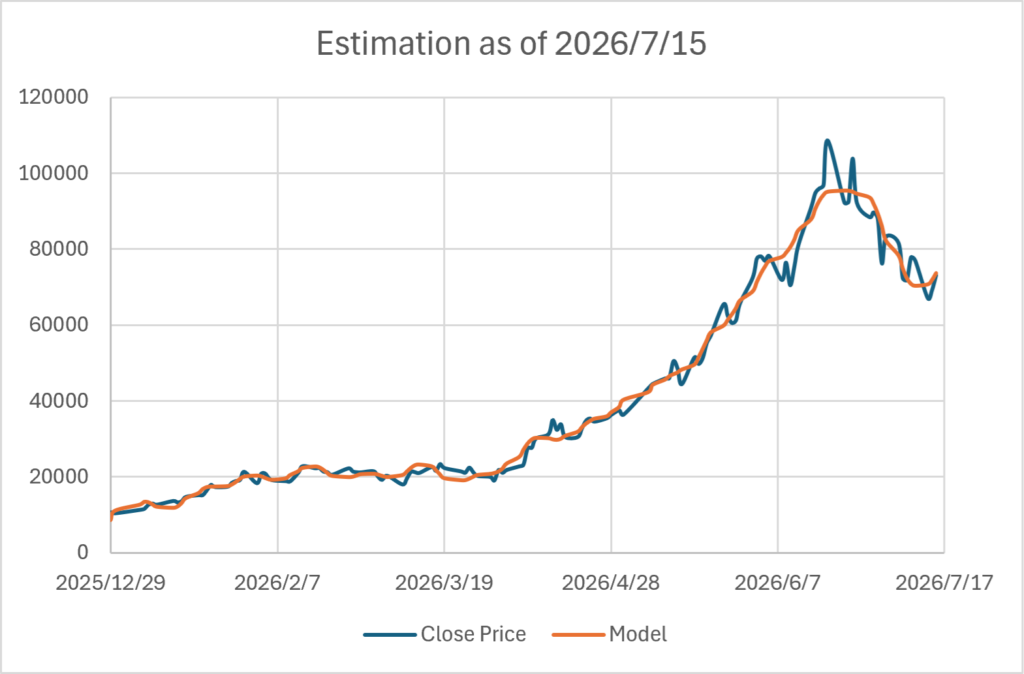
To assess the goodness of fit following regression analysis, a comparison between the intrinsic stock price \(\small \hat{x}(t) \) and the actual stock price yields the following result. It appears that the noise has been effectively filtered out and the trend successfully estimated (though, of course, there is no guarantee that this estimate is correct).
Finally, we present the profit and loss curve that would have resulted from historically taking a long position when momentum was positive and a short position when it was negative. Specifically, we calculated the cumulative profit and loss for a strategy that mechanically repeats the following process: estimate momentum based on the closing price of June 29, 2026; if positive, buy at the market open on June 30, 2026, and close the position at the market open on July 1, 2027. The actual calculation results, based on trading 100 shares each time, are as follows.
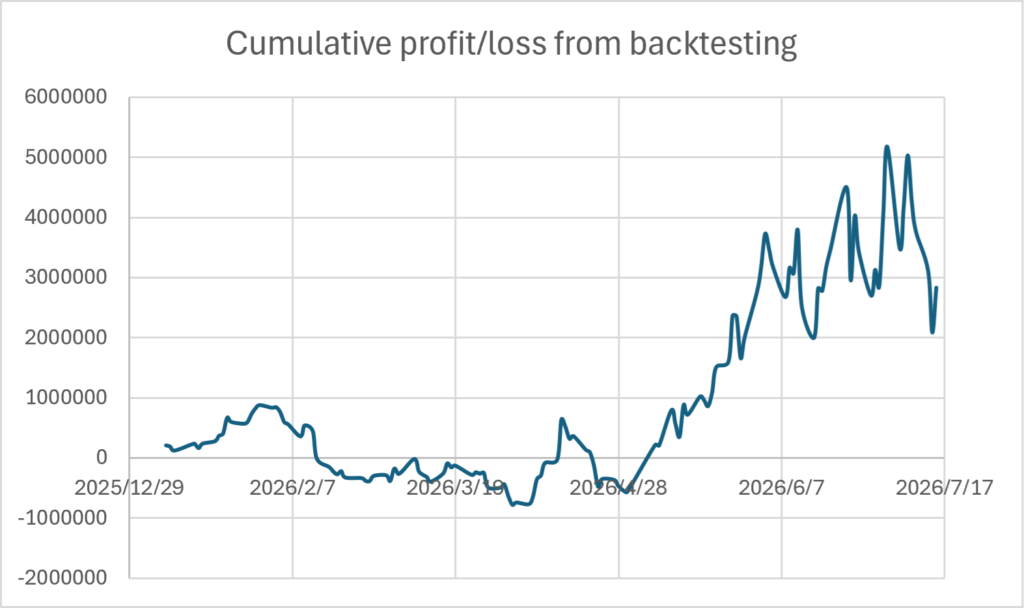
It is evident that substantial profits are being generated by focusing on stocks exhibiting the most favorable price movements for the “Momentum Chimpanzee.” Conversely, during periods of high volatility—such as July 2026—momentum estimates become less reliable, causing performance to appear to deteriorate. It is therefore considered best for the “Spiritual Momentum Chimpanzee” to monitor as many stocks as possible and continuously rotate capital into whichever ones are performing favorably at the time.
Conclusion
In this paper, we examined the mathematical model (quant model) for the “Spiritual Momentum Chimpanzee” trading model. By defining
- Spiritual Parameter \(\small c_1,\cdots,c_m\)
- Momentum/Oscillator Ratio \(\small \omega\)
- Time Horizon
- Portfolio Diversification
as a parameter, it should be possible to create countless trading models. The advantage of creating such a model to execute mechanical trades lies in the ability to curb negative psychological factors—such as the inability to cut losses or lock in profits, or indecision regarding stock selection. You might want to use the model presented here as a basis to devise your own model—one that reflects your personal beliefs and preferences. While I will not be introducing specific programs or code, tools like Claude Code or Codex would allow you to implement it without much difficulty.
*This article does not recommend the buying or selling of specific stocks or any particular trading strategies. Please undertake all investments and trading at your own risk.


Comments