
Overview
This is the second installment in a series on developing an NPC model that utilizes poker statistics as parameters. In the previous installment, we examined pre-flop play; in this one, we will examine post-flop play. At this stage, we will treat the algorithms for the Flop, Turn, and River as fundamentally the same, assuming that differences in behavior across each round are expressed through model parameters. In the post-flop phase, behavior is determined not by position but by whether the player is the aggressor (the player who raised last in the pre-flop round).
We define a player’s actions as having two options (Check, Bet) when no one has bet yet, and three options (Call, Fold, Raise) when a bet has already been made. The multipliers for Bet and Raise are set as parameters, and fixed multipliers are used (e.g., Bet is 50% of the pot, Raise is three times the bet amount).
Player Statistics Parameters in Post-flop Situations
The following parameters are set and used as post-flop statistics. Since strategies often vary significantly depending on position when three or fewer players remain post-flop, the parameters are adjusted based on position for two-player hands (IP (In Position) / OOP (Out of Position)) and three-player hands (IP / MP (Middle Position) / OOP).
- DB (Donk Bet): The percentage of times a bet is made before the aggressor acts
- Fold to DB: The percentage of times a player folds when a DB is made
- Raise to DB: The percentage of times a player raises against a DB
- CB (Continuation Bet): The percentage of times a bet is made when acting as the aggressor
- Fold to CB: The percentage of times a player folds when a CB is made
- Raise to CB: The percentage of times a player raises in response to a CB
- BMCB (Bet to Missed CB): The percentage of times an aggressor bets after checking
- Fold to BMCB: The percentage of times a player folds when a BMCB is made
- Raise to BMCB: The percentage of times a player raises in response to a BMCB
- 3Bet: The percentage of times a player raises further in response to a bet -> raise
- Fold to 3Bet: The percentage of times a player chooses to fold in response to a 3-bet
If you are the aggressor and no Donk Bet is made before you, base your decision on the CB. If a player has made a Donk Bet, base your decision on Fold to DB and Raise to DB. BMCB is a less common poker term that refers to the percentage of times an aggressor bets after checking. You occasionally see players who always bet after checking as the aggressor; for such players, the BMCB would likely be 100%. 3-bets are evaluated using the same parameters regardless of whether they are CB, DB, or BMCB.
Since there are three possible actions in each situation (Call, Fold, Raise), if a hand does not qualify for either a Raise or a Fold, Call is selected. The order of actions is Raise > Call > Fold, and Bet > Check; actions are chosen so that the parameter ratios correspond to the hands with the highest win rates. For implementation purposes, an arbitrary upper limit is set; here, we assume that no 3-bet or higher is made (i.e., we call or fold to a 3-bet). How to evaluate hand strength will be discussed in the next section.
Hand Strength Evaluation Model
The strength of a player’s hand after the flop is evaluated using Monte Carlo simulation. Given the player’s own hand and the face-up community cards, the remaining community cards and the opponent’s hand are simulated, and the expected value of winning the pot is used for evaluation. It is possible to specify and limit the opponent’s hand range by VPIP, but this would complicate the process, and since the purpose is to evaluate the strength of one’s own hand, the evaluation is performed assuming any hand.
This calculated expected value is denoted as \(\small p\), and the threshold of hand strength in each round (flop, turn, river) is determined by calculating quantiles from the pre-calculated probability distribution for each round. The probability distribution of equity in each round \(\small \phi_n(p)\) is estimated by sampling using Monte Carlo simulation (if the expected value is evaluated with 10,000 simulations for each of 100,000 scenarios, 1 billion simulation calculations will be required). \(\small n\) represents the number of remaining players. The actual estimated distribution is shown in the figure below. The distribution changes depending on the number of players, but the graph below shows the probability distribution \(\small \phi_3(p)\) in the case of 3 players (3-way).
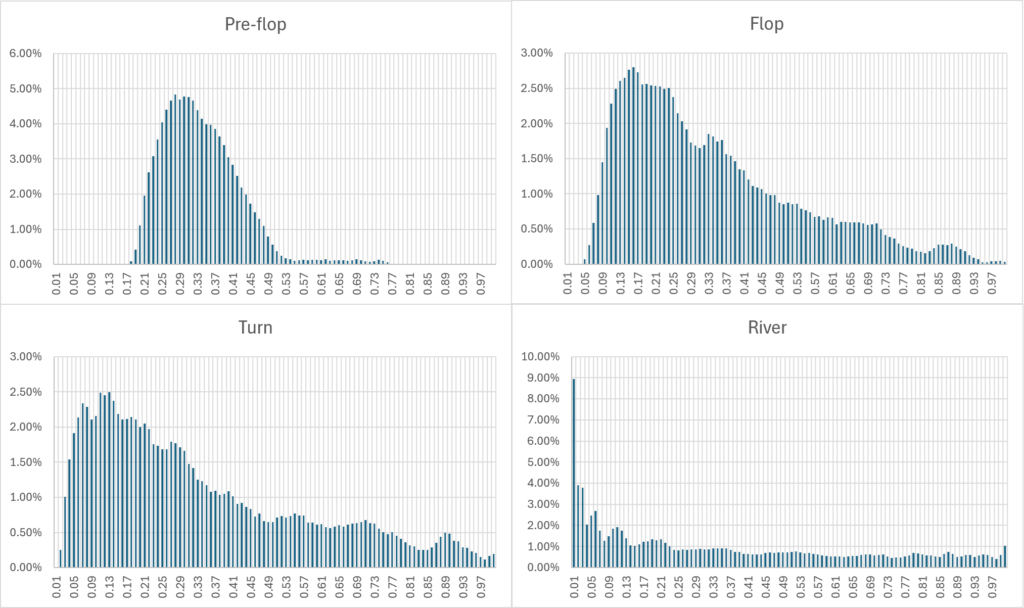
However, it is important to note that simply using this distribution does not guarantee that an appropriate threshold can be calculated. Hands that are weaker than the VPIP in the pre-flop are folded and generally do not remain in play after the post-flop. Therefore, it is necessary to define the probability distribution by limiting the range to only the hands entered pre-flop (hands that fall within the VPIP range). The probability distribution \(\small \phi_n(p|h)\) is calculated for each hand in the pre-flop, and the quantiles are estimated by aggregating only the range corresponding to the pre-flop hand range. \(\small h\) represents the hand symbol, such as AKo. The probability distribution can be a histogram of the samples, but it is better to have data approximated by a Gaussian Mixture Model or similar for easier aggregation.
We estimate the quantiles by aggregating only the probability distributions corresponding to hand ranges that fall within the VPIP range pre-flop. Hands outside the VPIP range are excluded because they are folded pre-flop. The weight of the hand \(\small w_i\) is:
- Off-suit: 12 / 1326
- Suited: 4 / 1326
- Pocket Pair: 6 / 1326
The probability distribution is obtained by aggregating the \(\small w_i\) of the hands included in the pre-flop hand range (H) as shown in:
\[\small \phi_n(p) = \frac{\sum_{i \in H}w_i \phi_n(p|h_i)}{\sum_{i \in H} w_i}. \]
We compare the value \(\small p\) obtained from the Monte Carlo simulation with the quantiles of this probability distribution function to determine the action.
Conclusion
Based on the content covered so far, we can consider that we have established a model for Texas Hold’em players who take stronger actions as their starting hands become stronger. In the upcoming series, we will cover:
- how to handle rules where it is not practical to specify hand ranges individually, such as in Omaha Hold’em
- how to handle situations where hand ranges are adopted that do not necessarily follow the order of hand strength (such as polarized ranges)
- methods for reflecting player preferences rather than win rates when determining hand priority
and other topics. Also, I mentioned earlier that it is advisable to approximate probability distributions using a Gaussian Mixture Model; I plan to prepare a brief explanation of this as well.


Comments